There are so many books about how to make maps, but not many asking how to think mapping. This isn’t exactly a how-to, rather the book offers insight into cartographical thinking or how we construct and re-construct the world around us through mapping and map making. It can be used by anyone interested in maps and the mysterious and rather magical way maps contain world upon worlds constructed with the barest of detail. What is more surprising is how persistent the image of map can be even in the face of empirical evidence to the contrary. We throw ourselves into the world of the map as in the world itself. The collusion of all of this worldmaking suggests our imaginative capacity to construct worlds parallels our rational capacity to manage them.
“Data Visualization for Design Thinking helps you make better maps. Treating maps as applied research, you’ll be able to understand how to map sites, places, ideas, and projects, revealing the complex relationships between what you represent, your thinking, the technology you use, the culture you belong to, and your aesthetic practices. More than 100 examples illustrated with over 200 color images show you how to visualize data through mapping. Includes five in-depth cases studies and numerous examples throughout.” – from the book cover
Available from your favorite bookseller HERE
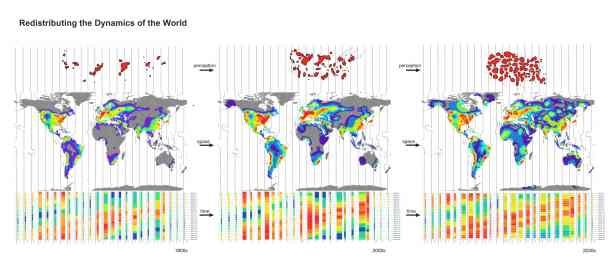
Figure 8: Redistributing the Dynamics of the World (Siliang Fu 2010)
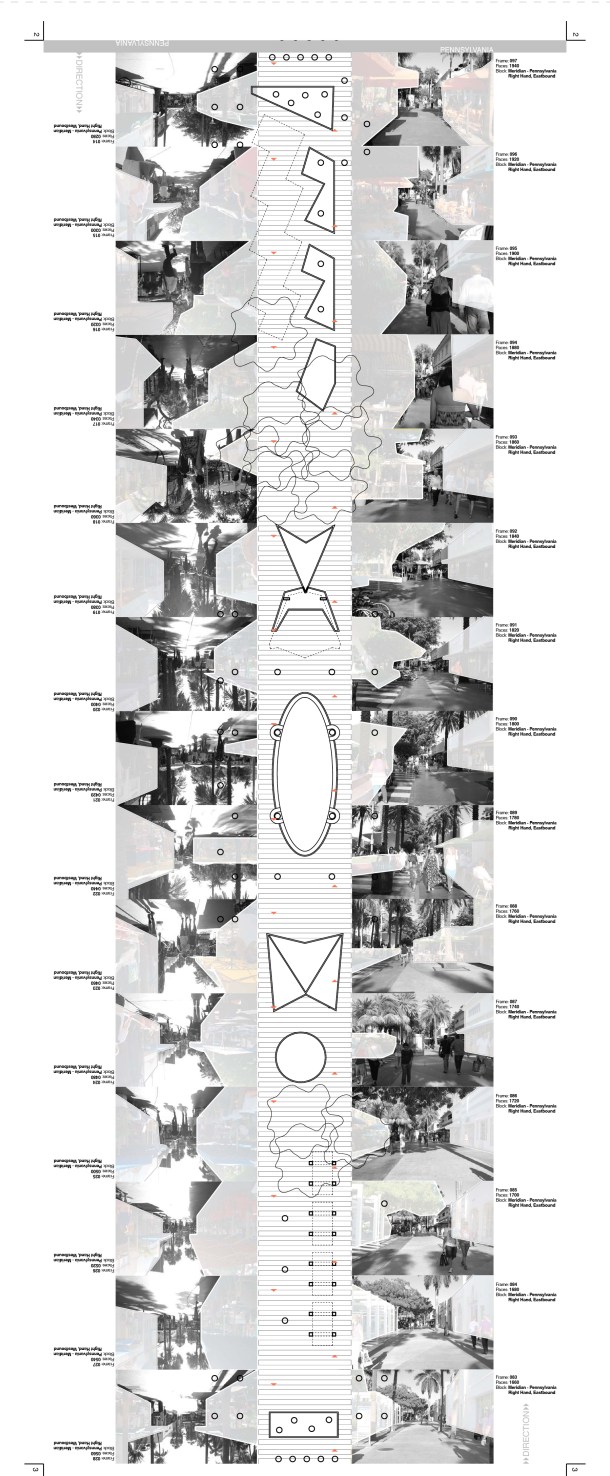
Figure 5: Everchanging Frame, The data for the map was collected on Lincoln Rd., Miami, Florida, 3/27/12 at 3:28-3:42 PM. (Daniel Alonso, 2010)
